
Common Ground is a periodic newsletter published by the Office Commissioner Body Corporate & Community Management. It contains all sorts of interesting articles including statistics. I find statistics like “how many strata schemes in Queensland” riveting stuff, so, in case you do too, I thought I’d share.
How Many Strata Schemes in Queensland?
There are 45,362 strata schemes registered in Queensland as at March 2016 or 431,368 lots in total.
- 70.4% of schemes have 6 lots and under (an average of 3.25 lots per scheme);
- 12.26% of schemes have 7 – 10 lots (an average of 8.32 lots per scheme);
- 8.28% of schemes have 11 – 20 lots (an average of 14.47 lots per scheme);
- 5.78% of schemes have 21 – 50 lots (an average of 32.24 lots per scheme);
- 2.35% of schemes have 51 – 100 lots (an average of 70.43 lots per scheme); and
- .92% of schemes have over 100 lots (an average of 161.86 lots per scheme).
These statistics were last published in September 2015. In the six months period an additional 628 schemes containing 8,516 additional lots have been registered.
Of those new schemes:
- 440 have 6 lots or less (an average of 2.76 lots per scheme);
- 52 have 7 – 10 lots (an average of 8.42 lots per scheme);
- 41 have 11 – 20 lots (an average of 14.8 lots per scheme);
- 64 have 21 – 50 lots (an average of 31.95 lots per scheme);
- 16 have 51 – 100 lots (an average of 73.56 lots per scheme); and
- 15 have over 100 lots accounting for 3,034 lots (an average of 202.26 lots per scheme).
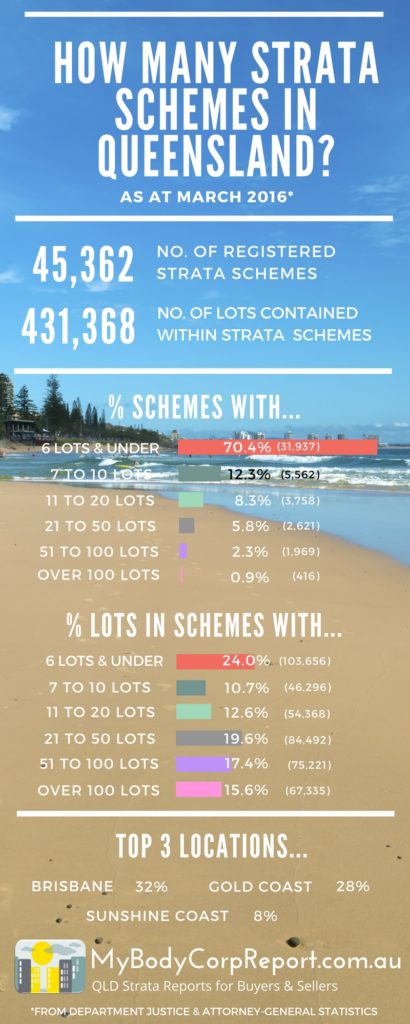
Over 70% of schemes in Queensland have 6 lots or less. Don’t be misled though; when considering total lots that translates to 24%.
Schemes with 51 lots or over account for only 3.2% of total schemes however a whopping 33% of total lots, a third of all schemes.
The bulk of schemes with 6 lots or less are made up of the many, many duplexes that are scattered predominantly throughout our outer suburbs.
By contrast a substantial proportion of larger schemes are located in urban areas and those inner circle suburbs surrounding them.
The stories of units are the story of our cities and there’s good reason for that. Cost of land, council zoning and of course client expectations all drive development decisions that determine where each type of scheme is built.
Other Interesting Statistics
There is a couple of other interesting nuggets of information contained within the statistics provided including breakdown per regulation module and the top five local authorities.
Breakdown per Regulation Module
| Regulation Module | No. of Schemes | % of Total Schemes |
| Standard | 28,966 | 63.74% |
| Accommodation | 9,457 | 20.81% |
| Commercial | 3,549 | 7.81% |
| Small Schemes | 1,969 | 4.33% |
| Specified Two Lot | 1,501 | 3.30% |
| TOTAL | 45,442* | 100% |
*This figure differs from the total given above. The error is transcribed from the source document.
20.81% of registered schemes are designated as Accommodation Module and are therefore eligible to enter into a 25 year agreement with a Caretaker. To me that’s surprising.
Schemes with 51 – 100 and over 100 lots, those that I would expect to be predominantly rental properties, add up to only 9.05% of schemes.
Add in the schemes with 11 to 20 lots and it still only adds up to 17.33% of schemes and makes it clear some schemes with 7 – 10 lots, or even smaller, are registered under Accommodation Module. It’s perplexing.
Sure it’s possible that a smaller scheme may be all rentals, hence Accommodation Module is appropriate, however less owners translates to more risk and correspondingly tighter controls offer more protection.
Five Local Authorities with the Most Bodies Corporate
| Local Authority | No. of Schemes |
| Brisbane City | 138,974 |
| Gold Coast | 118,931 |
| Sunshine Coast | 36,426 |
| Moreton Bay | 22,358 |
| Cairns | 20,347 |
No surprises there, though it is interesting the scale of the difference in number of schemes between Gold Coast and Sunshine Coast.
73% of all bodies corporate in Queensland are located in the South East, which corresponds roughly to the 70.2% of the population that lives here (as at 30/6/2013).
And there you have it. A snap shot of how many strata schemes in Queensland.
To read the full statistics as quoted in this article click here.
Want more statistics? Click here to see statistics regarding dispute resolutions.